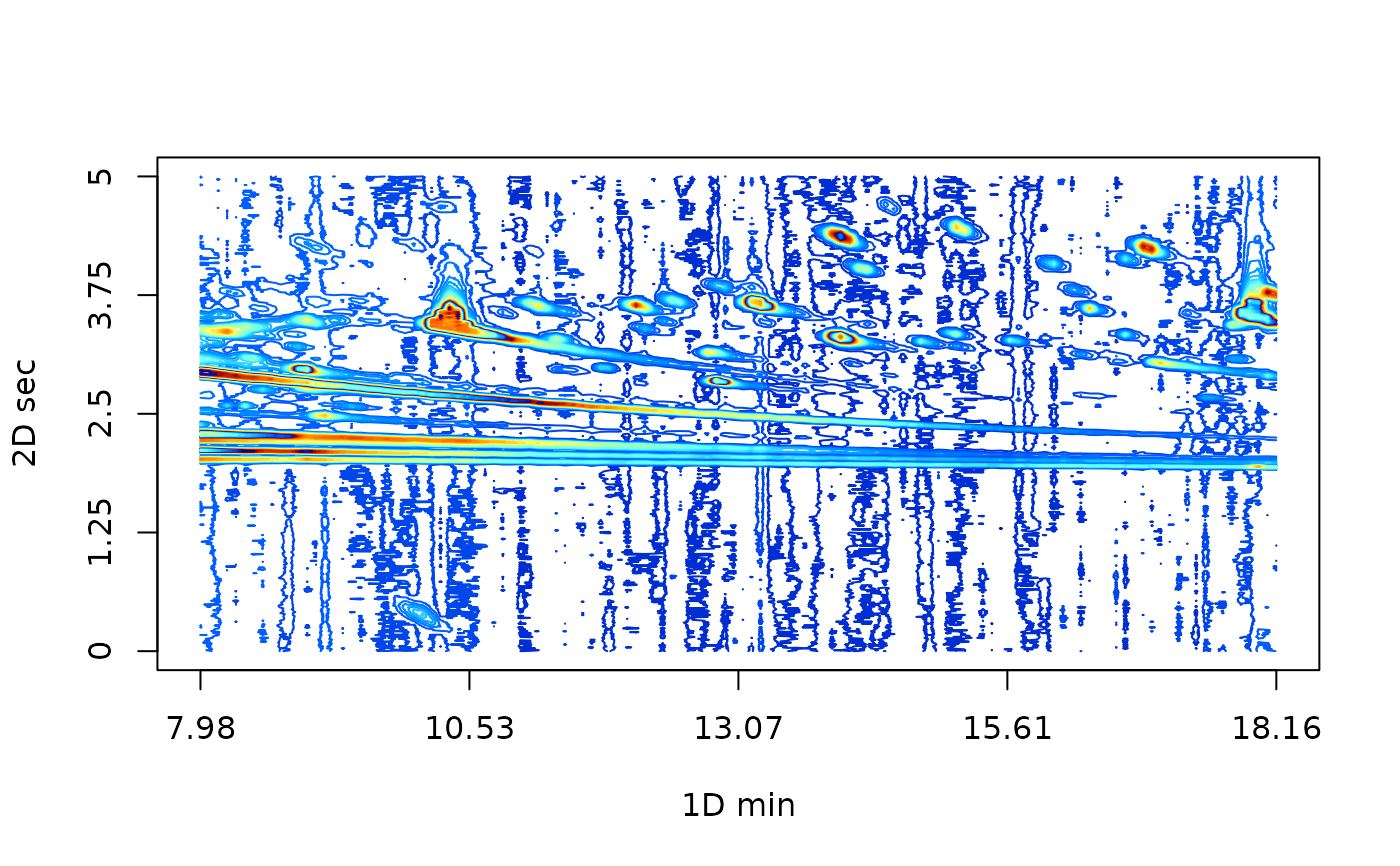
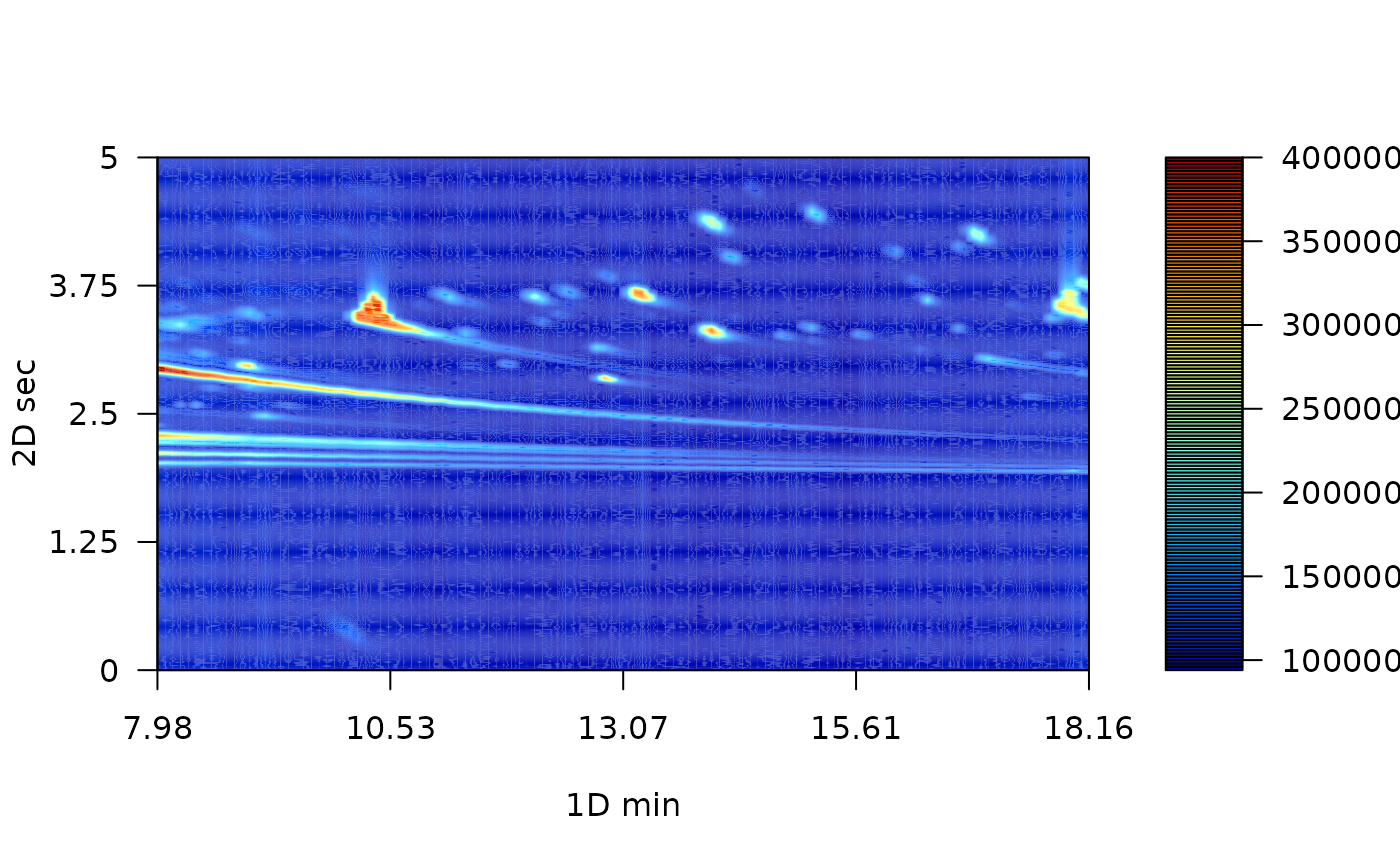
`plot` plot the two-dimensional chromatogram as a contour plot.
Arguments
- Object
a GCxGC chromatogram, it can be a raw, or preprocessed chromatogram.
- type
a character indicating the type of chromatogram representation. By default, type = "f" for
filled.contourfunction, if type = "c" only contours or isolines will be displayed by using thecontourfunction.- ...
Other parameters passed to
filled.contourorfilled.contourfunction, it depends on the value of the type argument.
Details
This plot function employs the built-in contour function. As mentioned in Reichenbach et al. (2004) , interpolation is used to display non-native GCxGC data.
References
Reichenbach SE, Ni M, Kottapalli V, Visvanathan A (2004). “Information technologies for comprehensive two-dimensional gas chromatography.” Chemometrics and Intelligent Laboratory Systems, 71(2), 107--120.
Examples
library(colorRamps)
chrom_name <-  system.file("extdata", "08GB.cdf", package = "RGCxGC")
chrom_2D <- read_chrom(chrom_name, 5L)
#> Warning: The last 51 signals will be omitted
#> Warning: data length [61051] is not a sub-multiple or multiple of the number of rows [500]
#> Retention time ranges:
#> 1D (min): 7.98 18.16
#> 2D (sec): 0 5
#> Acquisition rate: 100
plot(chrom_2D, nlevels = 150, color.palette = matlab.like)

plot(chrom_2D, type = "c", nlevels = 50, col = matlab.like(30))